Discover the Aggie Cupboard below
| Home | New Mexico Hunger | Food Safety | Volunteer | Impact | Donate Today | About Us |

Aggie Cupboard
Pete's Pantry in the Park (Monthly Mobile Food Pantry)
Impact area by month
| Month | Number of clients | Pounds of food distributed |
|---|---|---|
| Janurary | - | - |
| Februrary | - | - |
| March | - | - |
| April | - | - |
| May | - | - |
| June | - | - |
| July | - | - |
| August | - | - |
| September | - | - |
| October | - | - |
| November | - | - |
| December | - | - |
| Month | Number of clients | Pounds of food distributed |
|---|---|---|
| Janurary | 129 | - |
| Februrary | 165 | - |
| March | 135 | - |
| April | 129 | - |
| May | 93 | - |
| June | 94 | - |
| July | 103 | - |
| August | 55 | - |
| Septemeber | 99 | - |
| October | 114 | - |
| November | 186 | - |
| December | 100 | - |
| Month | Number of clients | Pounds of food distributed |
|---|---|---|
| Janurary | 221 | 4,714 |
| Februrary | 204 | 6,504 |
| March | 162 | 7,017 |
| April | 135 | 5,986 |
| May | 131 | 3,035 |
| June | 113 | 6,625 |
| July | 60 | 5,791 |
| August | 148 | - |
| September | 194 | - |
| October | 139 | - |
| November | 170 | - |
| December | 131 | - |
| Month | Number of clients | Pounds of food distributed |
|---|---|---|
| Janurary | 154 | 6,300 |
| Februrary | Software Error | |
| March | 227 | 6,908 |
| April | 193 | 6,217 |
| May | 119 | 7,304 |
| June | 138 | 6,464 |
| July | 103 | 6,338 |
| August | - | - |
| September | - | - |
| October | - | - |
| November | - | - |
| December | - | - |
| Month | Number of clients | Pounds of food distributed |
|---|---|---|
| Janurary | 96 | 4,800 |
| Februrary | 111 | 5,550 |
| March | 75 | 4,500 |
| April | 66 | 3,960 |
| May | 61 | 3,050 |
| June | 85 | 4,250 |
| July | 86 | 4,300 |
| August | 171 | 7,695 |
| September | 106 | 4,770 |
| October | 152 | 5,320 |
| November | 146 | 9,490 |
| December | Canceled/transportation |
*Change of location due to weather
Aggie Cupboard's Impact
Aggie Cupboard – Weekly Distributions
Impact table by semester
| Semester | Unique Clients | Clients Visits | Pounds of food distributed |
|---|---|---|---|
| Summer | 134 | 363 | 5,445 |
| Spring | 224 | 681 | 10,215 |
| Fall | 672 | 1,153 |
| Semester | Unique Visits | Client Visits | Pounds of food distributed |
|---|---|---|---|
| Summer | 108 | 365 | 5,475 |
| Spring | 233 | 462 | 5,475 |
| Semester | Unique Clients | Client Visits | Pounds of food distributed |
|---|---|---|---|
| Fall | 242 | 541 | 13,525 |
| Summer | 57 | 114 | 2,280 |
| Spring | 149 | 509 | 10,180 |
| Semester | Unique Clients | Client Visits | Pounds of food distributed |
|---|---|---|---|
| Fall | 224 | 685 | 10,275 |
| Summer | 83 | 219 | 2,847 |
| Spring | 546 | 1300 | 16,900 |
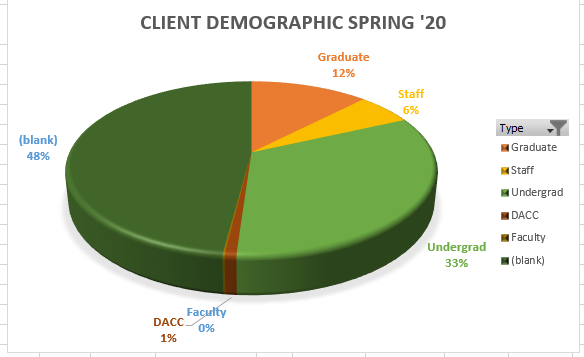
*Demographic information was not taken beginning on 3/17/20 to reduce client/volunteer interaction during COVID-19. All clients after 3/17/20 are listed as ‘blank’.